Output Options
The output section contains options to control how results are outputted and presented.
Results directory (results_dir)
This is used to select where the output should be saved. If the results directory command line argument is provided, this option is overridden.
Default is fitbenchmarking_results
[OUTPUT]
results_dir: fitbenchmarking_results
Make plots (make_plots)
This allows the user to decide whether or not to create plots during runtime. Toggling this to False will be much faster on large data sets.
Default is True (yes/no can also be used)
[OUTPUT]
make_plots: yes
Colourmap (colour_map)
Specifies the name of the colourmap the user wishes to use, e.g. magma, viridis, OrRd. Options are:
Any colourmap from the library in
matplotlib, see the complete library here.Appending
_rto the end of the name will reverse the colourmap.The following sequential colourmaps are recommended:
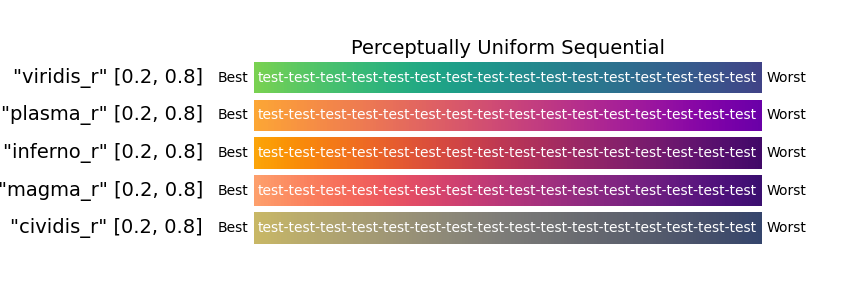
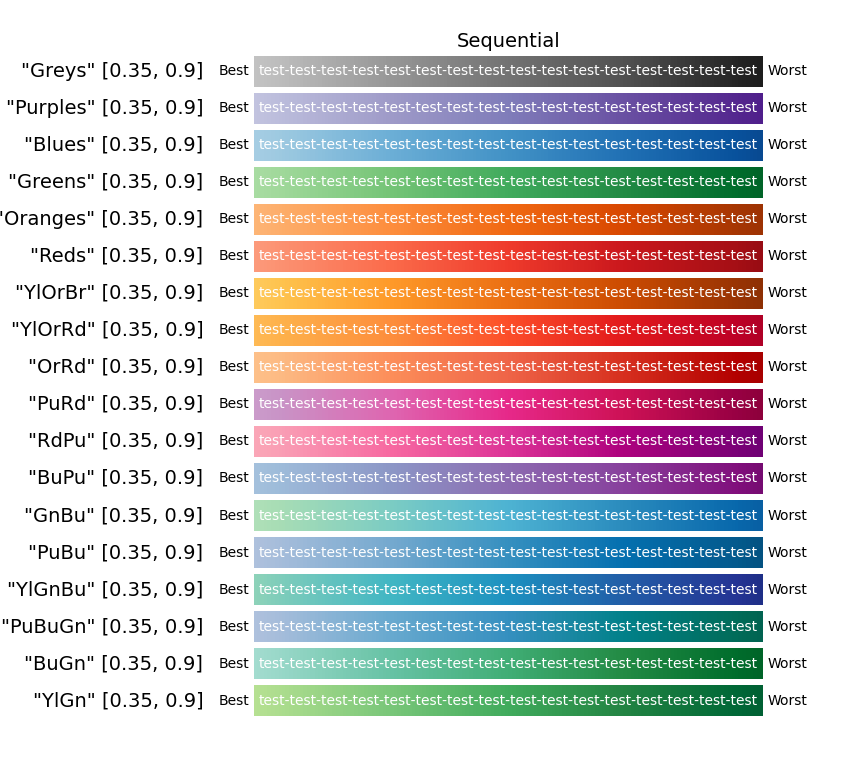
Default colourmap is magma_r
[OUTPUT]
colour_map: magma_r
Colourmap Range (cmap_range)
A two-element list used to specify the lower and upper limit of the chosen colourmap. Options are:
[lower_limit, upper_limit]where limits consider the full colourscale limits to be 0 and 1, so any pair of values must fall within this range.Limits should be introduced to make the white text readable, see the following example.
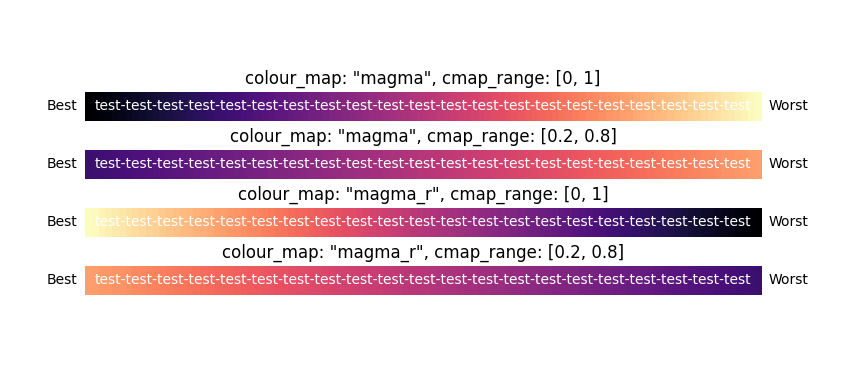
Default for magma is [0.2, 0.8] (suitability depends on colourmap)
[OUTPUT]
colour_map: magma_r
cmap_range: [0.2, 0.8]
Colour Upper Limit (colour_ulim)
Controls how relatively poorly a minimizer has to perform in order to receive the worst colour. For example, a value of 100 would mean that any performance greater than or equal to 100 times worse than the best minimizer would receive the worst colour. This ensures that colour scale is not compromised by especially poor relative results. Options are:
Any float between
1andnp.infRecommended value
100
Default is 100
[OUTPUT]
colour_map: magma_r
cmap_range: [0.2, 0.8]
colour_ulim: 100
Comparison mode (comparison_mode)
This selects the mode for displaying values in the resulting table
options are abs, rel, both:
absindicates that the absolute values should be displayedrelindicates that the values should all be relative to the best resultbothwill show data in the form “abs (rel)”
Default is both
[OUTPUT]
comparison_mode: both
Table type (table_type)
This selects the types of tables to be produced in FitBenchmarking. Options are:
accindicates that the resulting table should contain the chi squared values for each of the minimizers.runtimeindicates that the resulting table should contain the runtime values for each of the minimizers.compareindicates that the resulting table should contain both the chi squared value and runtime value for each of the minimizers. The tables produced have the chi squared values on the top line of the cell and the runtime on the bottom line of the cell.local_minindicates that the resulting table should return true if a local minimum was found, or false otherwise. The value of \(\frac{|| J^T r||}{||r||}\) for those parameters is also returned. The output looks like{bool} (norm_value), and the colouring is red for false and cream for true. This option is only meaningful for least-squares cost functions.energy_usageindicates that the resulting table should contain energy consumption (kWh) for each of the minimizers.
Default is acc, runtime, compare, local_min, and energy_usage.
[OUTPUT]
table_type: acc
            runtime
            compare
            local_min
            energy_usage
Run Dash (run_dash)
This allows the user to decide whether or not to run the Dash app. Toggling this to False means the more interactive (online) plots will not be available.
Default is True (yes/no can also be used)
[OUTPUT]
run_dash: yes
Multistart success threshold (multistart_success_threshold)
This allows the user to set the threshold to differentiate between the successful and unsuccessful fitted results in the multistart plots.
A value of 1.5 means that all results with a norm_acc of less than 1.5 will be classed successful while the rest will be classed unsuccessful.
The successful results will have blue traces while the unsuccessful results will have red traces in the multistart plots.
Setting a value between 1.0 and 2.0 is recommended.
Default is 1.5
[OUTPUT]
multistart_success_threshold: 1.2