How does FitBenchmarking work?
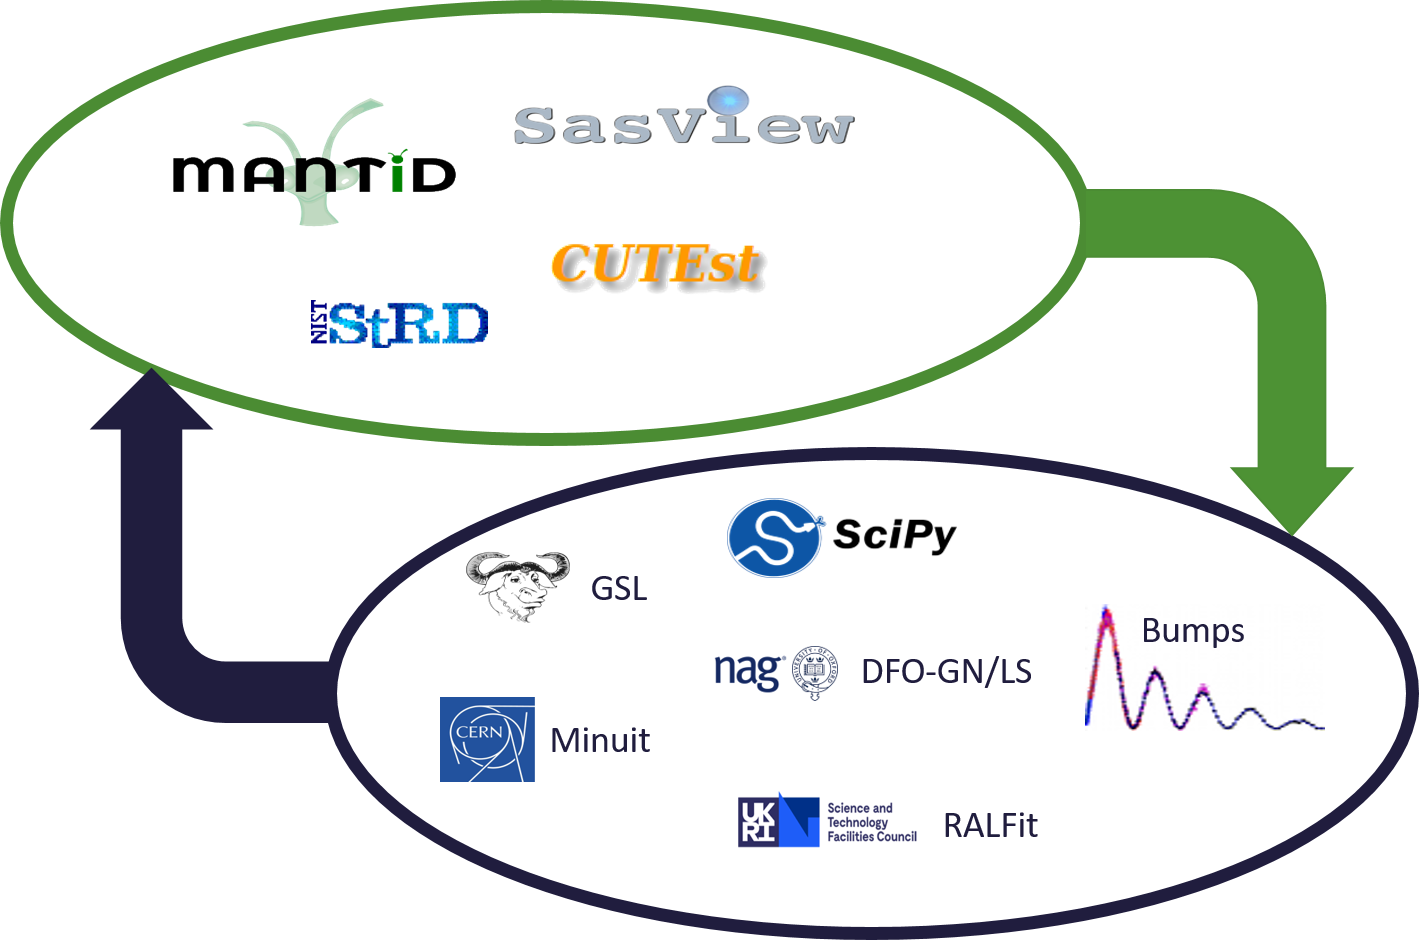
FitBenchmarking takes data and models from real world applications and data analysis packages. It fits the data to the models by casting them as a nonlinear least-squares problem. We fit the data using a range of data fitting and nonlinear optimization software, and present comparisons on the accuracy and timings.
The Benchmarking Paradigm
FitBenchmarking can compare against any of the supported minmizers listed in Minimizer Options. We’ve also made it straightforward to add new software by following the instructions in Adding Fitting Software – the software just needs to be callable from Python.
Once you have chosen which minimizers you want to compare for a given problem, running FitBenchmarking will give you a comparison to indicate the minimizer that performs best.
There are a number of options that you can pick to customize what your tests are comparing, or how they are run. A full list of these options, and how to select them, is given in the section FitBenchmarking Options.
FitBenchmarking creates tables, as given in the section FitBenchmarking Output, which show a comparison between the different minimizers available. An example of a table is:
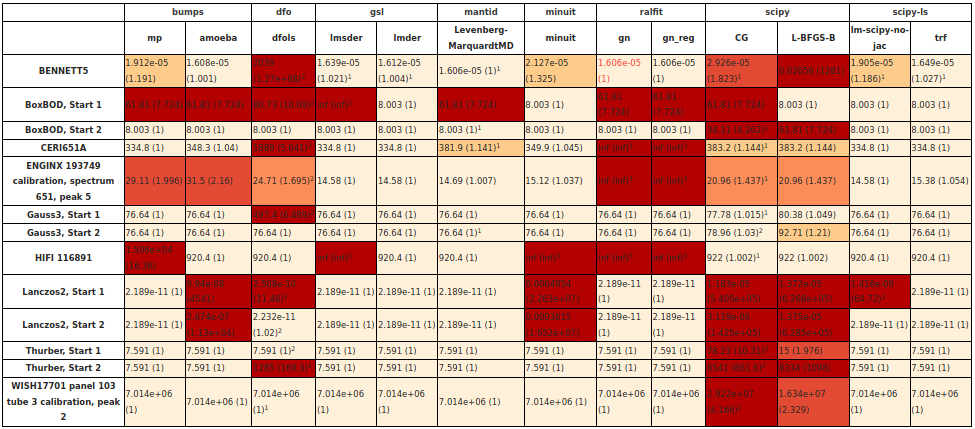
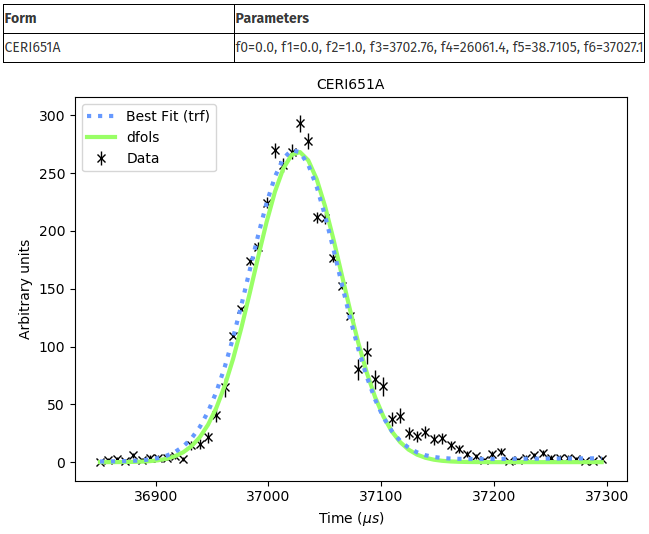
This is the result of FitBenchmarking for a selection of software/minimizers and different problem definition types supported in FitBenchmarking. Both the raw chi squared values, and the values normalised with respect to the best minimizer per problem, are given. The problem names link to html pages that display plots of the data and the fit that was performed, together with initial and final values of the parameters. Here is an example of the final plot fit:
Performance Profile
With each test FitBenchmarking also produces a Dolan-Moré performance profile:
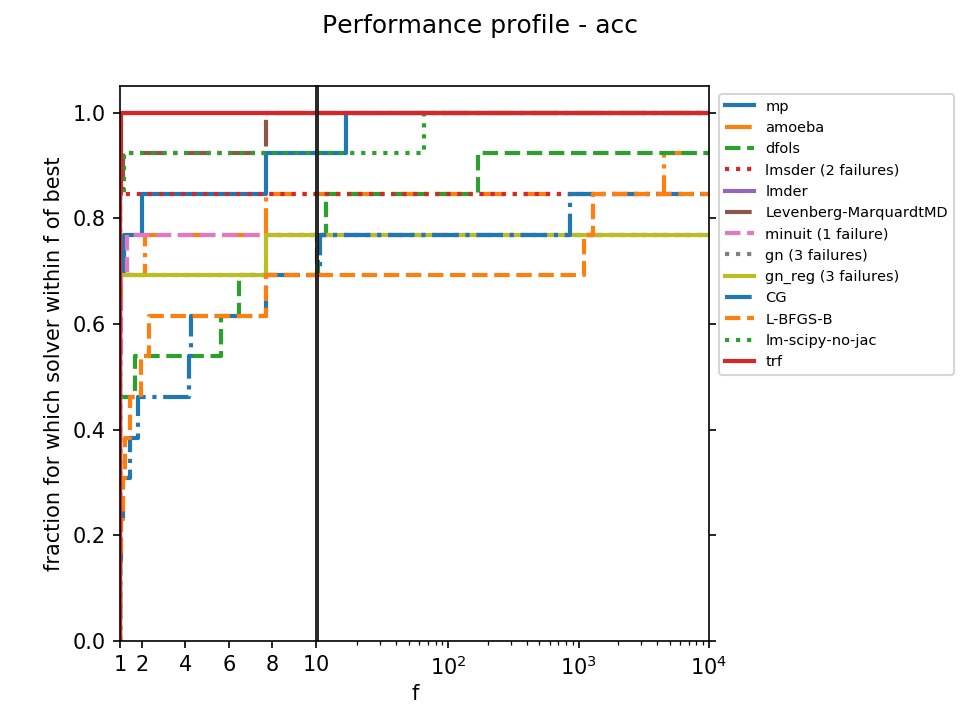
The solvers appearing in the top left corner may be considered the best performing on this test set. See Dolan and Moré (2001) for more information.