Why is FitBenchmarking important?
Fitting a mathematical model to data is a fundamental task across all scientific disciplines. (At least) three groups of people have an interest in fitting software:
Scientists, who want to know what is the best algorithm for fitting their model to data they might encounter, on their specific hardware;
Scientific software developers, who want to know what is the state-of-the-art in fitting algorithms and implementations, what they should recommend as their default solver, and if they should implement a new method in their software; and
Mathematicians and numerical software developers, who want to understand the types of problems on which current algorithms do not perform well, and to have a route to expose newly developed methods to users.
Representatives of each of these communities have got together to build FitBenchmarking. We hope this tool will help foster fruitful interactions and collaborations across the disciplines.
Example workflow
The black crosses on the plot below are data obtained from an experiment at the VESUVIO beamline at ISIS Neutron and Muon source:
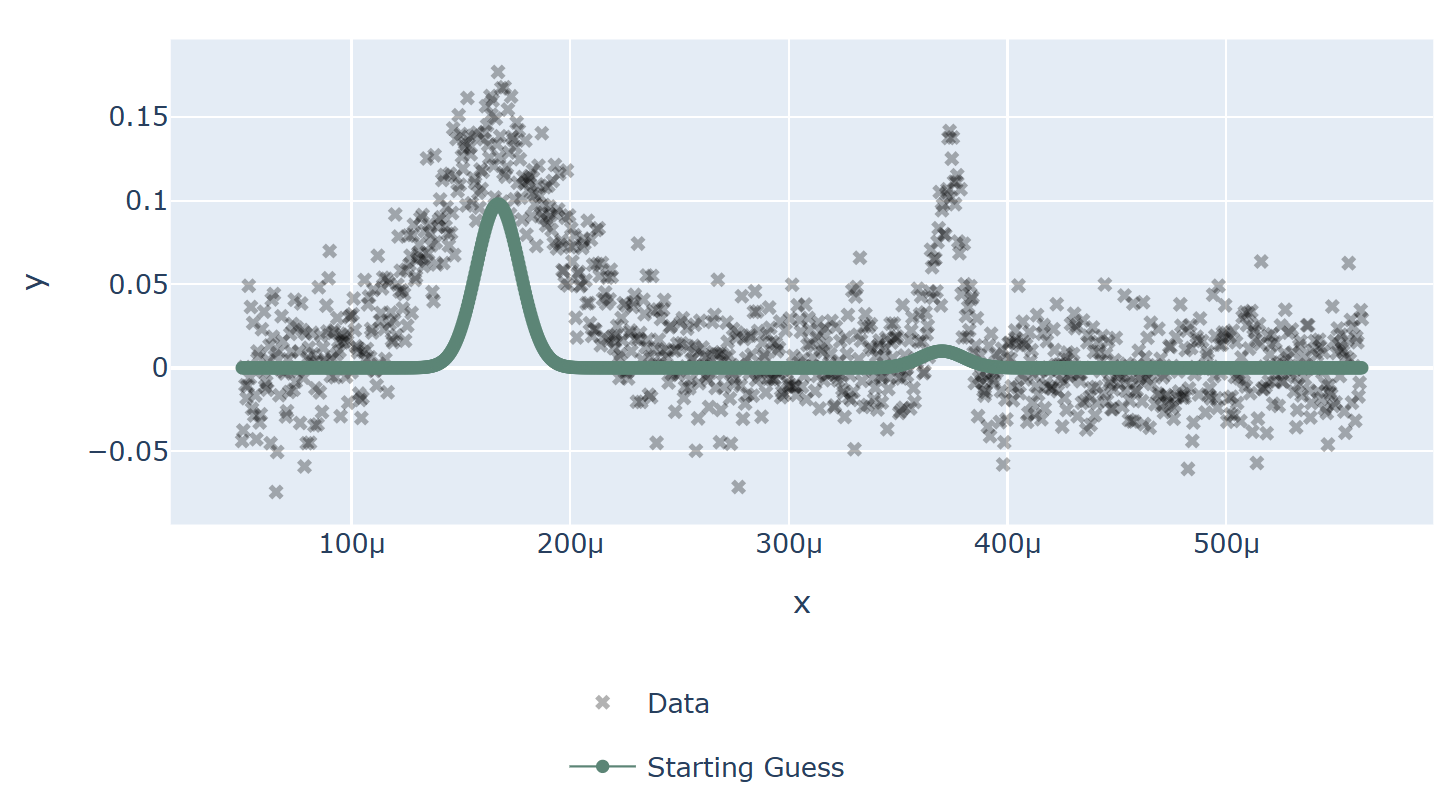
VESUVIO experiment data
The scientist needs to interpret this data, and will typically use a data analysis package to help with this. Such packages are written by specialist scientific software developers, who are experts in analysing the kind of data produced by a given experiment; examples include Mantid, SasView, and Horace.
These packages include mathematical models, which depend on parameters, that can describe the data. We need to find values for the parameters in these models which best fit the data – for more background, see this Wikipedia article. The usual way this is done is by finding parameters that minimize the (weighted) squares of the error in the data, or \(\chi^2\) value. This is equivalent to formulating a nonlinear least-squares problem; specifically, given \(n\) data points \((x_i, y_i)\) (the crosses in the figure above), together with estimates of the errors on the values of \(y_i\), \(\sigma_i\), we solve
where \(f({\boldsymbol{\beta}};x)\) is the model we’re trying to fit, and \(\boldsymbol{\beta}\) are the parameters we’re trying to find.
Usually the scientist will supply a starting guess, \({\boldsymbol{\beta}}_0\) (the green curve in the graph above), which describes where they think the solution might be. She then has to choose which algorithm to use to fit the curve from the selection available in the analysis software. Different algorithms may be more or less suited to a problem, depending on factors such as the architecture of the machine, the availability of first and second derivatives, the amount of data, the type of model used, etc.
Below we show the data overlayed by a red curve, which is a model fitted using the
implementation of the Levenberg-Marquardt algorithm from the GNU Scientific Library (lmsder).
The algorithm claims to have found a local minimum with a \(\chi^2\) error of 15.87 in 0.0067 seconds.
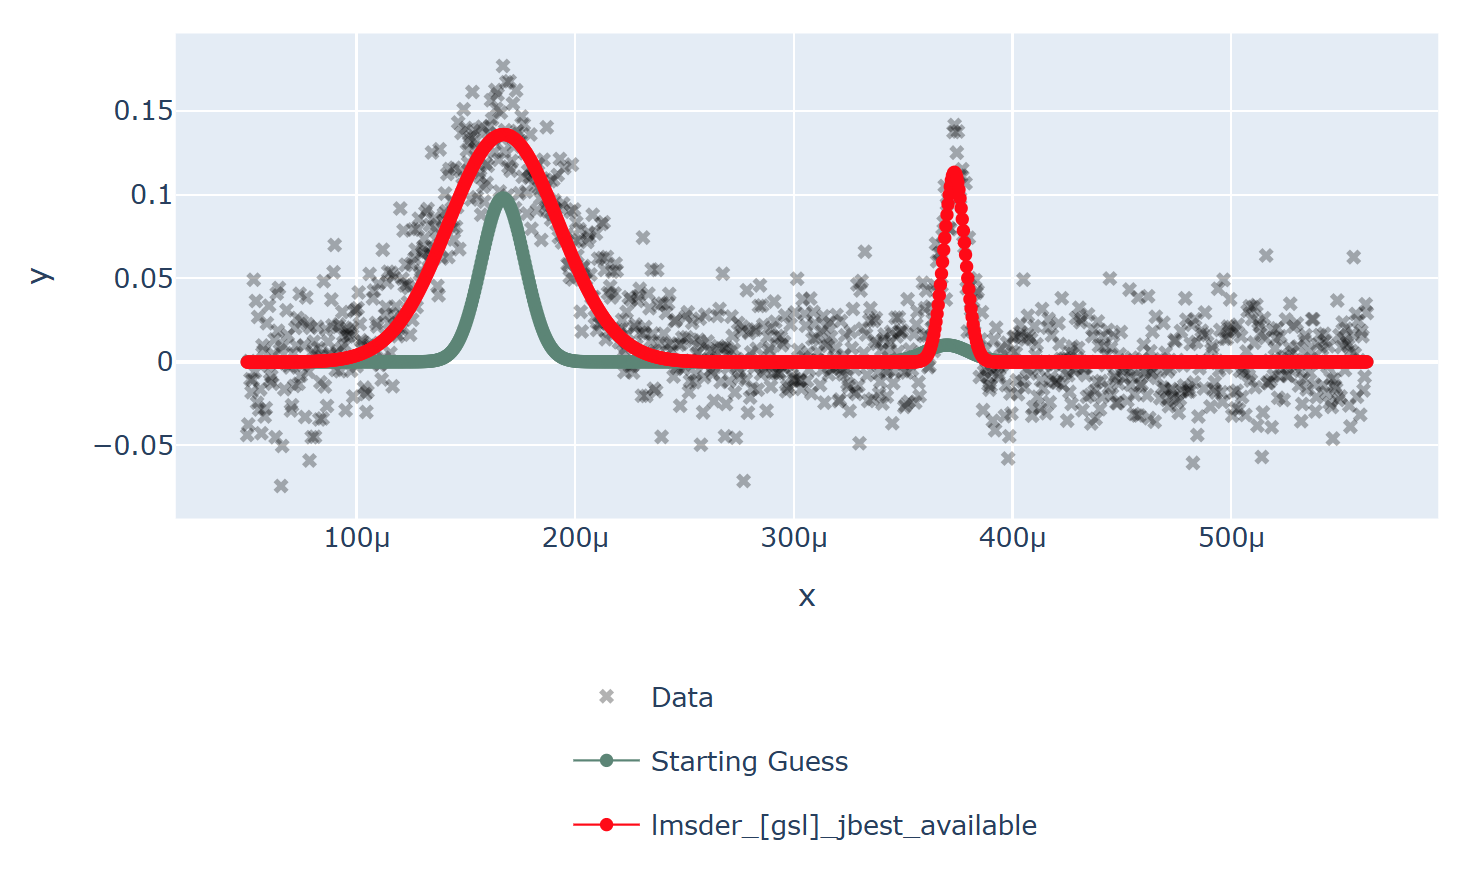
GSL’s lmsder (Levenberg-Marquardt) algorithm on the data
We also solved the nonlinear least squares problem using SciPy’s implementation of
a Constrained Optimization BY Linear Approximation (COBYLA) algorithm (COBYLA),
which claimed to solve the problem in less time (0.0060 seconds) but with a much higher \(\chi^2\) error of
39.88. The curve obtained is plotted in red below and the previous curve
is in dotted-blue for comparison.
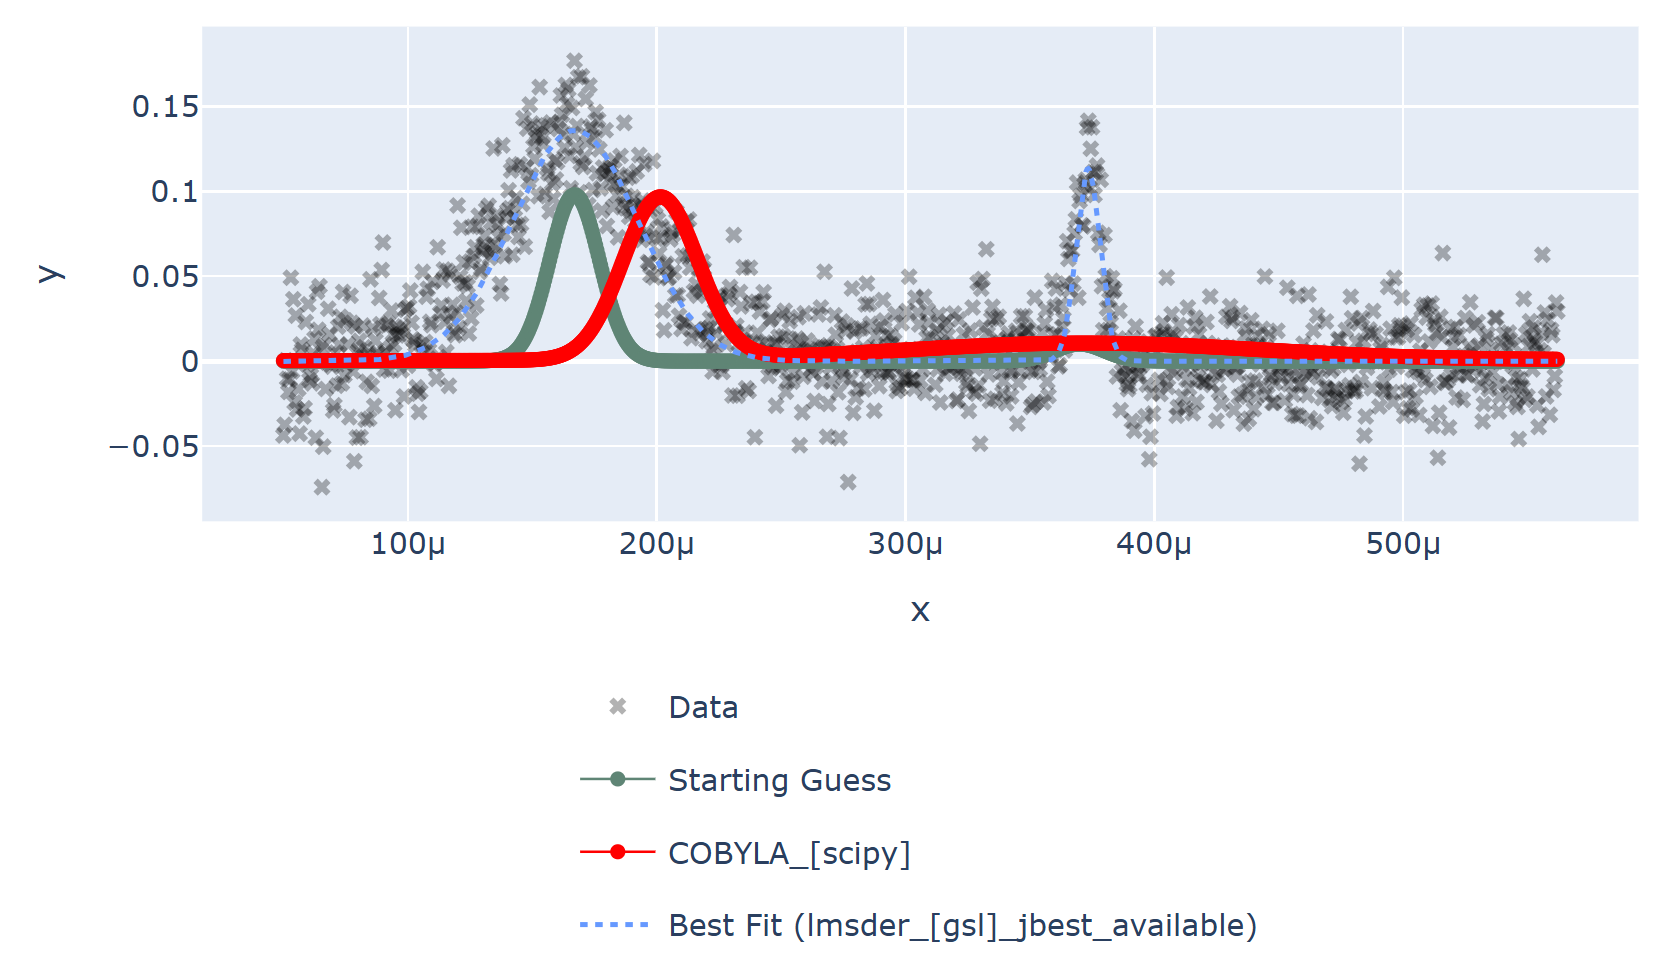
SciPy’s COBYLA (Constrained Optimization BY Linear Approximation) algorithm on the data
By eye it is clear that the solution given by lmsder is better.
As the volume of data increases, and we do more and more data analysis
algorithmically, it is increasingly important that we have the best algorithm
without needing to check it by eye.
FitBenchmarking will help the scientist make an informed choice by comparing runtime and accuracy of all available minimizers, on their specific hardware, on problems from their science area, which will ensure they are using the most appropriate minimizer.
FitBenchmarking will help the scientific software developer ensure that the most robust and quickest algorithms for the type of data analysis they support are available in their software.
FitBenchmarking will help mathematicians see what the state of the art is, and what kinds of data are problematic. It will give them access to real data, and will give a route for novel methods to quickly make it into production.
A workflow as described above plays a crucial role in the processing and analysis of data at large research facilities in tasks as diverse as instrument calibration, refinement of structures, and data analysis methods specific to different scientific techniques. FitBenchmarking will ensure that, across all areas that utilise least-squares fitting, scientists can be confident they are using the best tool for the job.
We discuss the specific FitBenchmarking paradigm in the Section How does FitBenchmarking work?